Preliminary Result
01/12/2010 (Mw 7.0), Haiti
Anthony Sladen, Caltech
Location of Epicenter |
Amount of Slip on Fault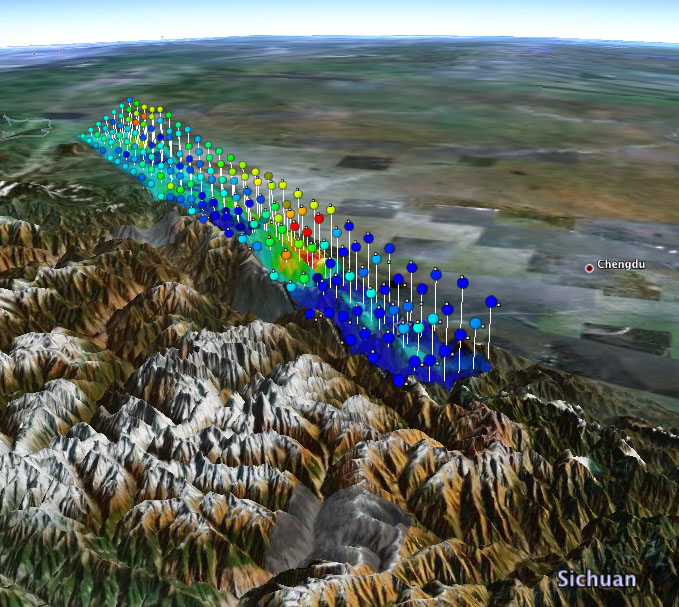
View in Google Earth (requires Google Earth) Colors show the amount of slip on diferent sections of the fault zone. Two views are shown (either view can be de-selected on the Google Earth sidebar):
|
Overview

|
Haiti is located at the boundary between the Caribbean plate and the North America plate.
The rectangle in the figure shows the location and length of the earthquake ruputure zone along this boundary. The red star indicates the epicenter. The rupture extended about 35 km (22 miles). The colors show the slip amplitude (i.e., the amount by which the land on one side of the fault moved with respect to the land on the other side). The motion was mainly strike-slip (i.e., land on one side of the fault moving horizontally with respect to land on the other side). The rupture originated at the epicenter (red star) about 10 km (6 miles) below the surface. In some places, the vertical slippage along the fault line was as large as 4 meters (12 feet), shown by red-shaded areas. This slip map was generated from a numerical model that uses seismological records from all over the world. |
DATA Process and Inversion
We used the GSN broadband data downloaded from the IRIS DMC. We analyzed 21 teleseismic P waveforms and 16 teleseismic SH waveforms selected based upon data quality and azimuthal distribution. Waveforms are first converted to displacement by removing the instrument response and then used to constrain the slip history based on a finite fault inverse algorithm (Ji et al, 2002). The epicenter location is slightly shifted from the USGS estimate (Lon.= -72.445 ° Lat.=18.505 °) but not the depth (10 km). The strike (262°) is chosen in order to align the fault plane with the estimated location of the major Enriquillo-Plaintain Garden fault (USGS Earthquake Hazard Program). The dip angle (70 °) is taken from the GCMT solution and the 1D velocity model is extracted from the CRUST2.0 global tomography model (Bassin et al., 2000).UPDATE: I reprocessed the data using the updated NEIC location of the epicenter which is now more to the west. Again, to align the top of our fault geometry with the major Enriquillo-Plaintain Garden fault trace, I had to shift the epicenter 5km to the north. All figures below correspond to the solution recomputed with this new epicentral location.
Result
The solution is made of one major slip patch stretched about 20 km west and updip from the epicenter. The slip is mostly left-lateral, with a significant component of thrust motion.Cross-section of slip distribution
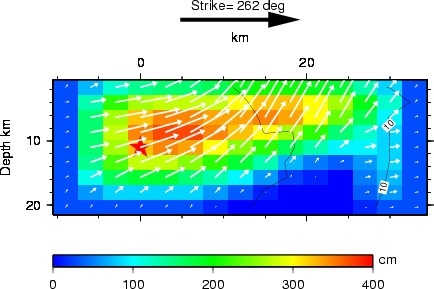
Figure 1: The colors show the slip amplitude and white arrows indicate the direction of motion of the hanging wall relative to the footwall. Contours correspond to the propagation of the rupture front, and the red star indicates the hypocenter location. The big black arrow gives the orientation of the fault plane.
Comparison of data and synthetic seismograms
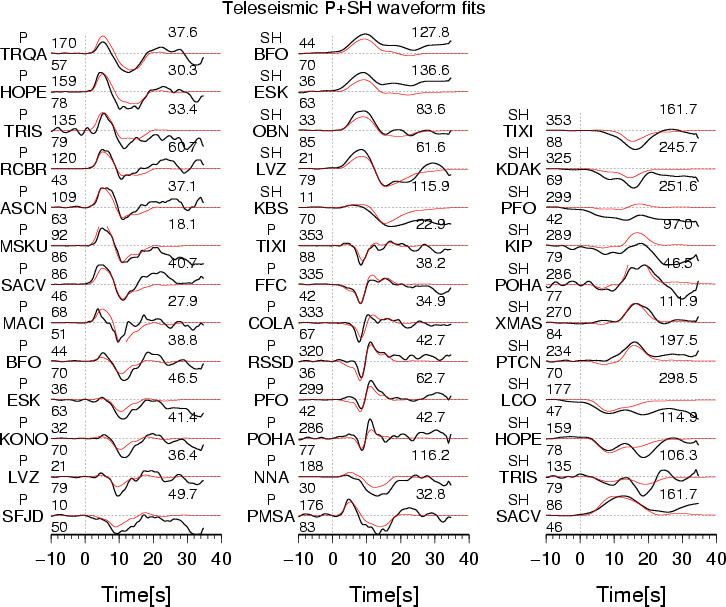
Figure 2: The Data are shown in black and the synthetic seismograms are plotted in red. Both data and synthetic seismograms are aligned on the P or SH arrivals. The number at the end of each trace is the peak amplitude of the observation in micro-meter. The number above the beginning of each trace is the source azimuth and below it is the epicentral distance.
Map view of the slip distribution
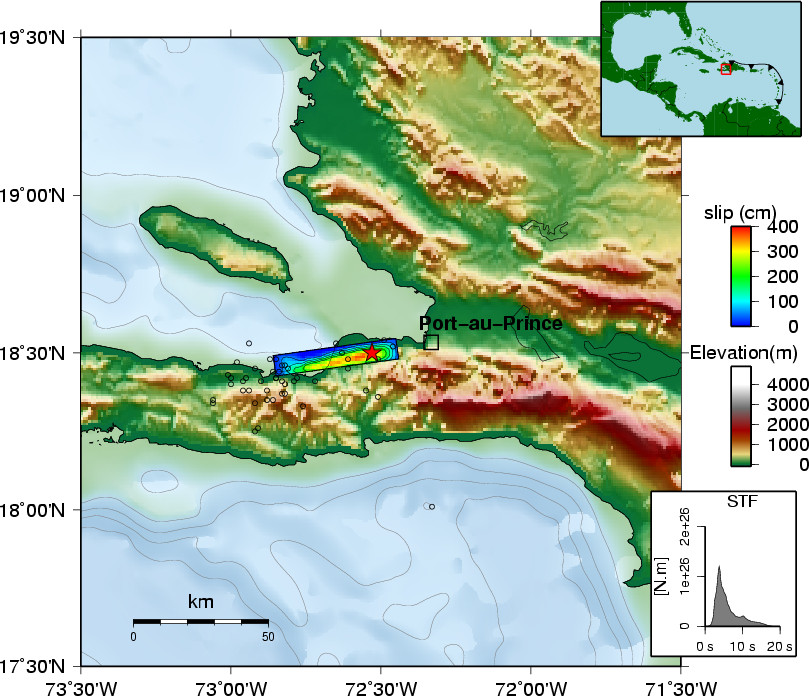
Figure 3: Surface projection of the fault plane slip distribution. The red star represents the epicenter of this event. The open circles are the aftershocks located by USGS in the days following the event.
Map view of the surface deformation
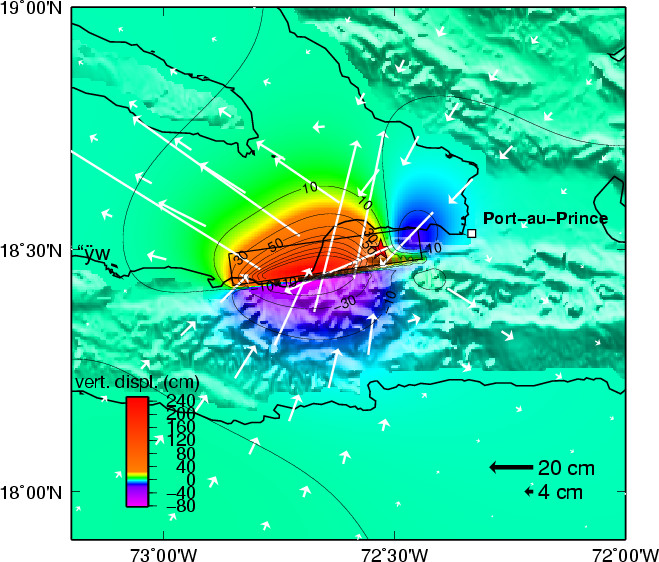
Figure 3: Surface deformation predicted from the slip model. The vertical component of displacement is given by the color scale, and the horizontal motion by the arrows.
Surface deformation in the direction of ALOS satellite
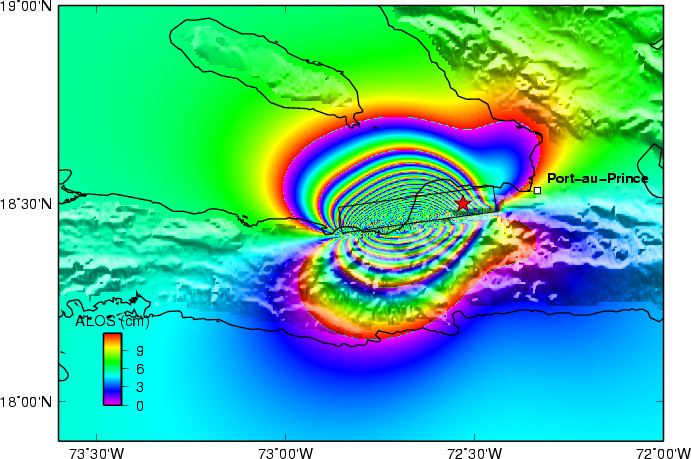
Figure 4: Predicted motion of the ground in the line-of-sight of satellite ALOS. This deformation is wrapped at a rate of 11.8cm and can be compared to the ascending track 138 interferogram processed by the Japanese spatial agency JAXA.
Comments:
Jan. 18, 2010:Because the resolution on a Mw=7.0 event is quite limited at teleseismic distance, both fault planes of the GCMT solution (151/64/158 and 251/70/28) can explain the data equaly well. In this analysis, we favored the E-W orientation because it is compatible with the major Enriquillo-Plantain Garden fault. With the orientation of the fault fixed, we find that solutions with the fault plane dipping to the south (for the E-W orientation of the fault), as suggested by some focal mechanism solutions (NEIC, USGS), do not fit the seismograms as nicely as with the north dipping fault plane.
Jan. 20, 2010:
The preliminary InSAR ALOS-PALSAR data (see caption of Figure 4) now confirms that the rupture was along the major Enriquillo-Plantain Garden fault.
Download
(Slip Distribution)
| SUBFAULT FORMAT | CMTSOLUTION FORMAT | SOURCE TIME FUNCTION |
References
Ji, C., D.J. Wald, and D.V. Helmberger, Source description of the 1999 Hector
Mine, California earthquake; Part I: Wavelet domain inversion theory and resolution
analysis,
Bassin, C., Laske, G. and Masters, G., The Current Limits of Resolution for
Surface Wave Tomography in North America, EOS Trans AGU, 81, F897, 2000.
GCMT project: http://www.globalcmt.org/
USGS National Earthquake Information Center: http://neic.usgs.gov
Global Seismographic Network (GSN) is a cooperative scientific facility operated jointly by the Incorporated Research Institutions for Seismology (IRIS), the United States Geological Survey (USGS), and the National Science Foundation (NSF).