Updated Result
05/12/2008 (Mw 7.9), East Sichuan
A.Sladen, Caltech, E.Fielding, Caltech-JPL
Location of Epicenter |
Amount of Slip on Fault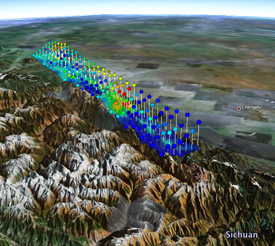
View in Google Earth (requires Google Earth) Colors show the amount of slip on diferent sections of the fault zone. Two views are shown (either view can be de-selected on the Google Earth sidebar):
|
DATA Process and Inversion
This is an update of our preliminary analysis based on the results published in Fielding et al. (2013). The source model is obtained by joint inversion of 468 GPS sites measurements, 35 teleseismic body waveforms (21 P and 14 SH), 9 L-band ALOS PALSAR interferograms, one Wide-beam ALOS PALSAR interferogram and 5 Envisat ASAR interferograms. We used a modified epicenter location (Lon.=103.348° Lat.=30.914°). The fault geometry is adjusted to the complex surface rupture mapped from the SAR pixel offset tracking using 5 planar fault segments. The dip angle of those fault segments is based on structural geology and the fit to the data.The solution is a unilateral rupture to the north-east over almost 300 km. The average rupture velocity is about 2.8 km/sec.
Result
.Cross-section of slip distribution
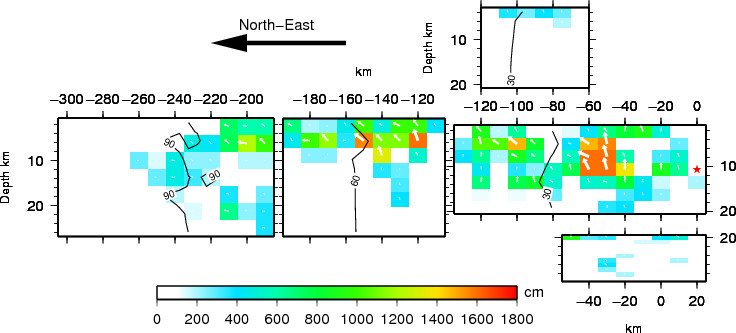
Figure 1: The big black arrow shows the fault's strike. The colors show the slip amplitude and white arrows indicate the direction of motion of the hanging wall relative to the footwall. Contours show the rupture initiation time and the red star indicates the hypocenter location.
Comparison of data and model predictions
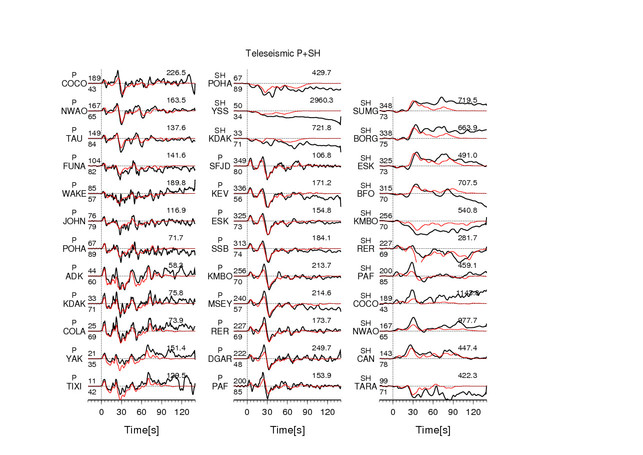
Figure 2: The teleseismic data are shown in black and the synthetic seismograms are plotted in red. Both data and synthetic seismograms are aligned on the P or SH arrivals. The number at the end of each trace is the peak amplitude of the observation in micro-meter. The number above the beginning of each trace is the source azimuth and below it is the epicentral distance.
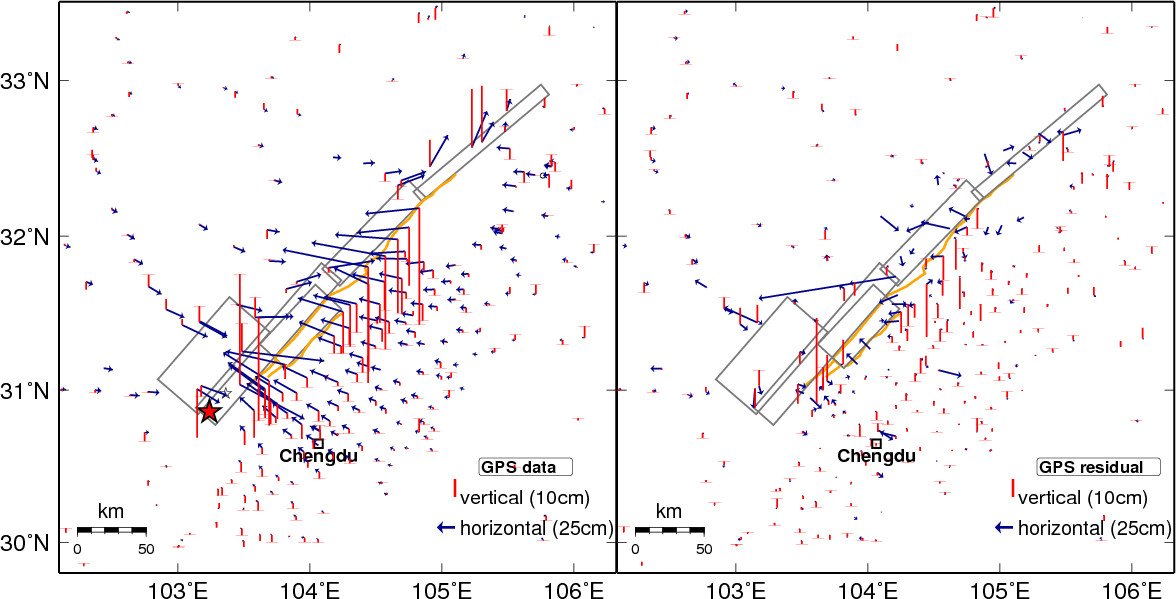
Figure 3: The Data are shown in black and the synthetic seismograms are plotted in red. Both data and synthetic seismograms are aligned on the P arrivals. The number at the end of each trace is the peak amplitude of the observation in micro-meter. The number above the beginning of each trace is the source azimuth and below it is the epicentral distance.
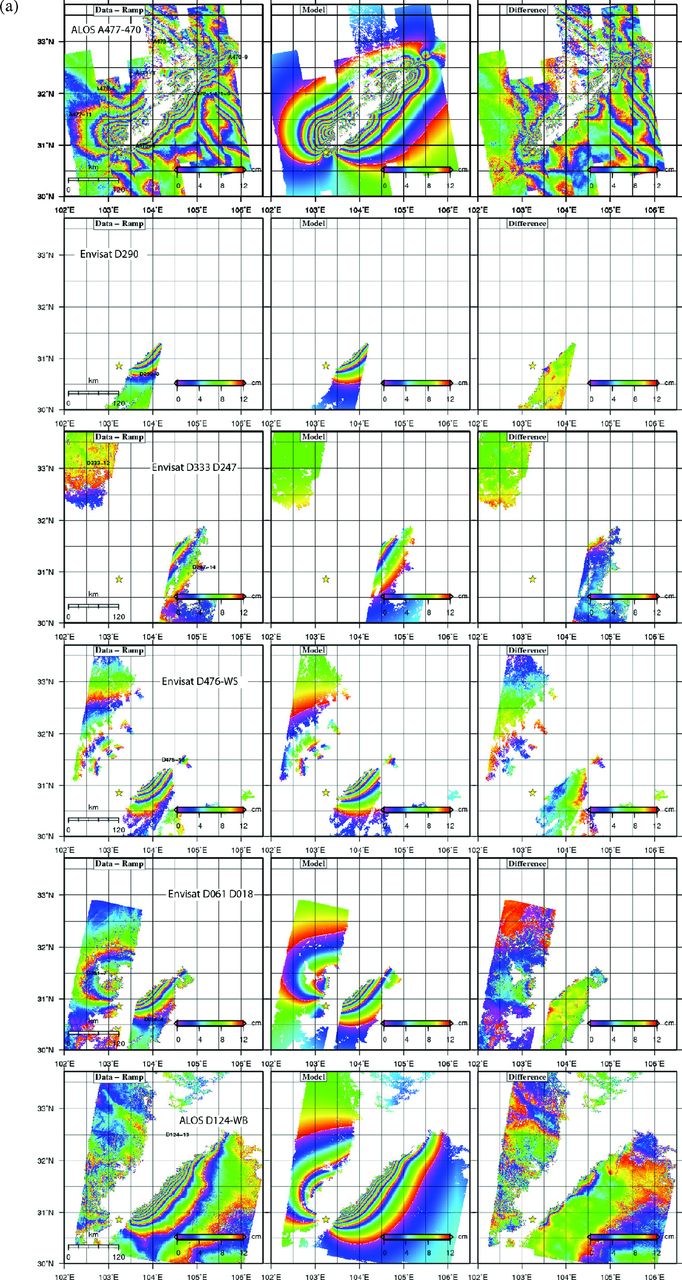
Figure 4: Maps of InSAR data after ramp removal (left column), preferred kinematic model final slip prediction from joint inversion projected into radar LOS (centre) and difference between data and model (right). (a) Wrapped interferograms, where the LOS motion has been rewrapped with a 12 cm colour cycle. Interferogram tracks are listed in each row. (b) Unwrapped interferograms where the colour scale is continuous with a range between −80 and 80 cm.
Map view of the slip distribution
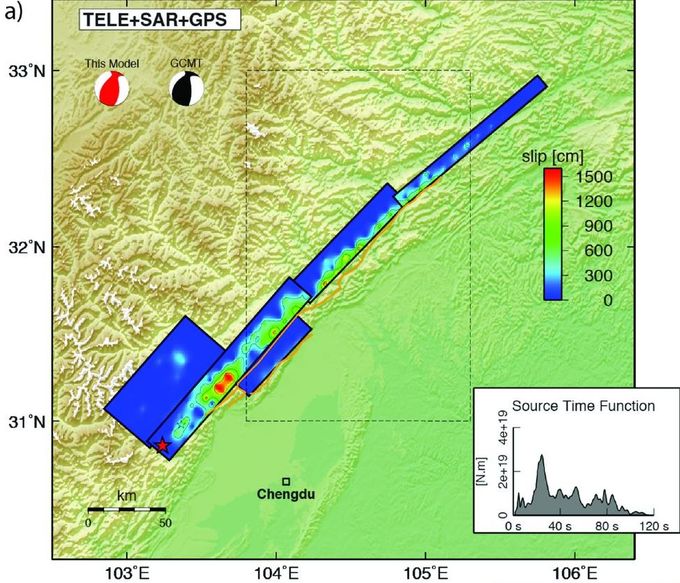
Figure 5: Surface projection of the slip distribution.
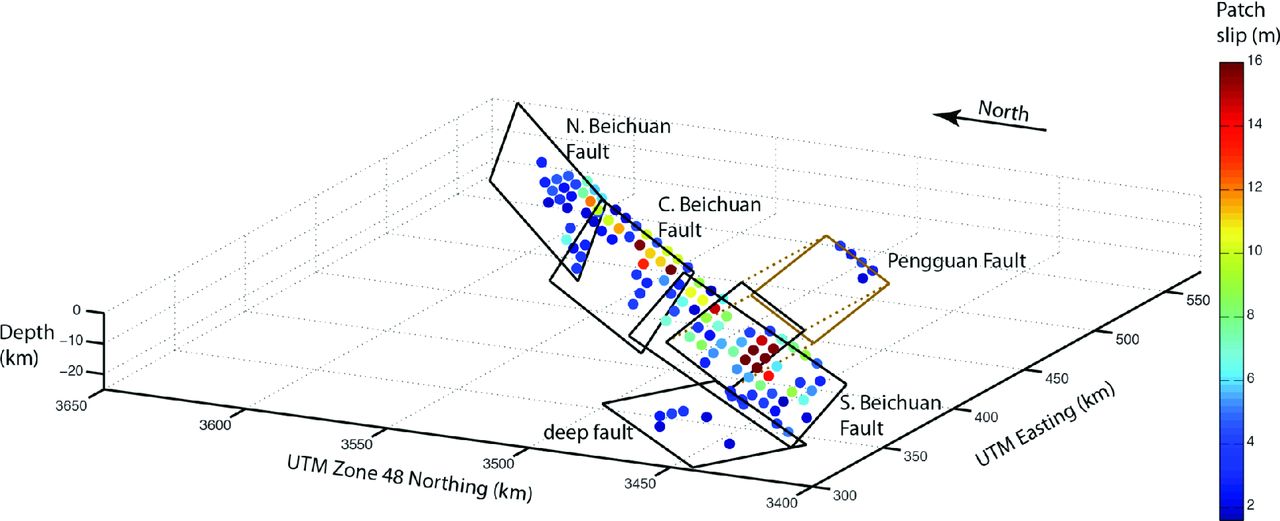
Figure 6: 3D view of the fault geometry with colored dots representing the slip amplitude if superior to 2m.
Download
(Slip Distribution)| SUBFAULT FORMAT | FSP FORMAT | CMTSOLUTION FORMAT | SOURCE TIME FUNCTION |
References
Fielding, E.J., Sladen, A., Zhenhong, L., Avouac, J.P., Burgmann, R., Ryder, I., Kinematic fault slip evolution source models of the 2008 M7.9 Wenchuan earthquake in China from SAR interferometry, GPS and teleseismic analysis and implications for Longmen Shan tectonics, Geophysical Research International, doi:10.1093/gji/ggt155, 2013.Ji, C., D.J. Wald, and D.V. Helmberger, Source description of the 1999 Hector Mine, California earthquake; Part I: Wavelet domain inversion theory and resolution analysis,
GCMT project: http://www.globalcmt.org/
USGS National Earthquake Information Center: http://neic.usgs.gov
Global Seismographic Network (GSN) is a cooperative scientific facility operated jointly by the Incorporated Research Institutions for Seismology (IRIS), the United States Geological Survey (USGS), and the National Science Foundation (NSF).
‹Back to Slip Maps for Recent Large Earthquakes home page